Earthquake early warning systems
Real-time magnitude assessment from statistical analysis of strong-motion accelerograms: To provide a short-term warning of ground shaking from strong earthquakes, the source parameters have to be determined rapidly and sufficiently reliable. To mitigate the damage, various actions could be initiated automatically, but only if the seismic source parameters are determined rapidly. Location and origin time of an earthquake can be assessed rather well. The major problem of an early warning system seems to be the real-time estimation of the earthquake's size.
Based on the 1933 to 1986 data set provided by the U.S. Geological Survey in 1992, we investigated digitized strong-motion accelerograms from more than 200 earthquakes in North- and Central America (Fig. 1) to find out, whether their initial portions reflect the size of the ongoing earthquake. Applying conventional methods of time series analyses we calculated various signal parameters, the peak acceleration, the predominant frequency and the related Fourier amplitude, from the first second of each accelerogram and describe their variability in relation to epicentral distance, magnitude and peak acceleration.
Multilinear regression analyses, based on an empirical relation between various signal parameters, reveal that the magnitude of an ongoing earthquake can be predicted from the first second of a single accelerogram within ±1.36 magnitude units with 95% statistical probability. The resulting magnitude estimate M is given by
M = (4.48 + 0.33 M* + 0.56 / f) ± 1.36
with M* = 1/0.249 (log A + log [sqrt (D² + 7.3²)] + 0.00255 sqrt (D² + 7.3²) + 1.02); after Joyner & Boore, 1981 (Bull. Seis. Soc. Am., 71, 2011-2038). D is the epicentral distance, A the peak acceleration within the first second and f the predominant frequency. Converting the error into units of seismic energy yields an uncertainty of four orders of magnitude, which seems to be inappropriate for an early warning system. The 95%-uncertainty can be reduced to about ±0.5 magnitude units by computing an average magnitude estimate from initial portions of a larger number of accelerograms recorded by a dense network of seismic stations (Fig. 2).
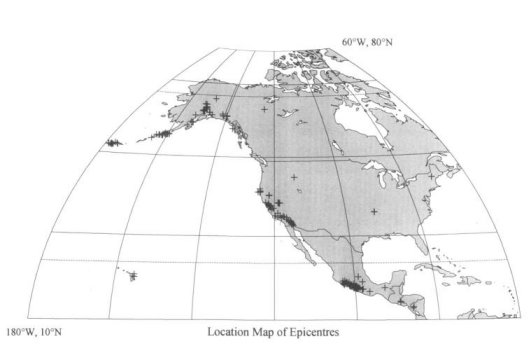
Fig. 1: The statistical analysis is based on 850 3-component accelerograms from more than 200 earthquakes (Map by K. Lehmann)
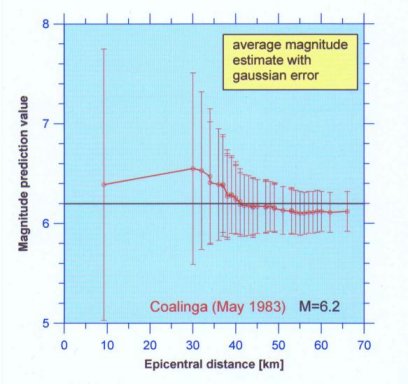
Fig. 2: The average magnitude prediction value as a function of the number of available accelerograms arranged with increasing epicentral distance. The magnitude of the Coalinga earthquake (ML=6.2) is indicated by a straight black line. The first analysed accelerogram of the earthquake was recorded in an epicentral of nearly 10 km. The first second information and revealed a magnitude estimate of about 6.4 ±1.36. This error is reduced significantly by calculating an average magnitude estimate. Including the first second information of 8 accelerograms recorded within an epicentral distance of 37 km reveals a magnitude estimate of 6.4 ±0.5.
Publication
Grecksch, G. & Kümpel, H.-J. (1997): Statistical analysis of strong-motion-accelerograms and its application to earthquake early warning systems. - Geophysical Journal International, 129, 113-123
Earthquake early warning systems
Reservoir triggered seismicity in Koyna (India)
European HDR test site Soultz-sous-Forêts (France)